Bollinger Bands Explained: How to Trade Volatility and Price Extremes
A complete guide to Bollinger Bands: the middle, upper and lower bands, the squeeze, band walks, the best settings, and Bollinger Band trading strategies for volatility and mean reversion in forex.
FX Terminal Research · 2026-07-24 · 4 min read
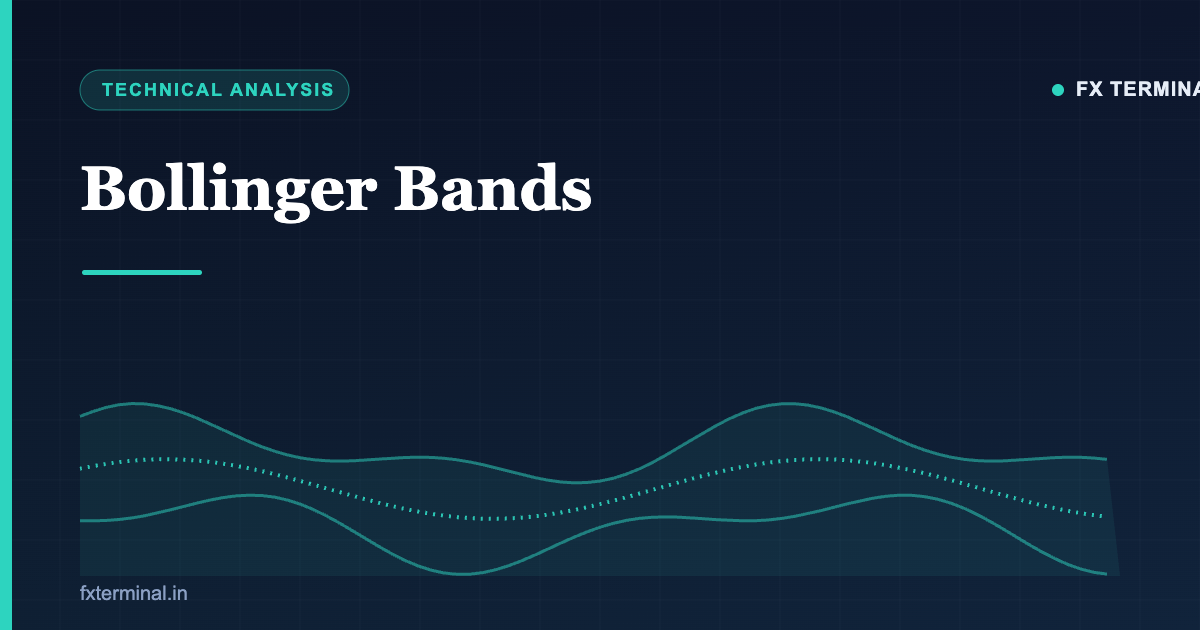
Bollinger Bands are a volatility-based indicator that wraps price in a dynamic envelope, showing at a glance whether a market is calm or explosive, overstretched or coiling for a move. Created by John Bollinger in the 1980s, they are one of the most versatile tools in technical analysis. This guide explains how Bollinger Bands work, how to trade the squeeze and band walks, the best settings, and the mistakes to avoid.
What are Bollinger Bands?
Bollinger Bands consist of three lines plotted around price:
- Middle band — a simple moving average, usually the 20-period SMA.
- Upper band — the middle band plus two standard deviations of price.
- Lower band — the middle band minus two standard deviations of price.
Because the outer bands are based on standard deviation (a measure of volatility), they automatically widen when volatility rises and contract when it falls. That self-adjusting nature is what makes Bollinger Bands so useful.
How to read Bollinger Bands
The bands tell you two things at once — volatility and relative price level:
| Observation | What it suggests |
|---|---|
| Bands widen | Volatility is increasing; a strong move is underway |
| Bands narrow (squeeze) | Volatility is low; a big move may be coming |
| Price touches the upper band | Price is relatively high within its recent range |
| Price touches the lower band | Price is relatively low within its recent range |
Crucial nuance: touching the upper band is not an automatic sell signal. In a strong uptrend, price can ride the upper band for a long time — this is called a band walk and signals strength, not exhaustion.
The Bollinger Band squeeze
The squeeze is the most famous Bollinger Band signal. When the bands contract tightly, volatility has collapsed and the market is coiling. A squeeze often precedes a powerful breakout — but it does not tell you the direction.
How traders play the squeeze:
- Spot the bands narrowing to an unusually tight range.
- Wait for price to break decisively out of the range.
- Enter in the direction of the breakout, ideally confirmed by a rise in volume or momentum.
- Place a stop on the opposite side of the squeeze.
Bollinger Band trading strategies
1. Mean reversion in a range
In sideways markets, price tends to oscillate between the bands. Traders buy near the lower band and sell near the upper band, expecting a reversion to the middle band. This works only when there is no strong trend.
2. Riding the band walk (trend)
In a trend, do the opposite of mean reversion: treat repeated touches of the upper band as confirmation of strength and stay with the trend, using the middle band as a trailing support.
3. The double bottom / double top with bands
A W-bottom forms when price makes a low outside the lower band, then a second low inside it — a bullish reversal clue. The mirror image, an M-top, warns of a bearish reversal.
Best Bollinger Band settings
The default and most widely used setting is a 20-period SMA with 2 standard deviations — the configuration John Bollinger himself recommends. Adjustments:
- Shorter period (e.g. 10) — more responsive, for shorter timeframes.
- Wider deviation (2.5) — fewer band touches, for very volatile markets.
- Narrower deviation (1.5) — more touches, for calmer markets.
Most traders leave the defaults alone, because they are robust across markets and timeframes.
Combining Bollinger Bands with other tools
Bollinger Bands work best with a momentum confirmation:
- Pair with the RSI to confirm overbought/oversold band touches.
- Pair with the MACD to confirm the direction of a squeeze breakout.
- Use support and resistance to filter which band touches to trade.
Common Bollinger Band mistakes
- Selling every upper-band touch in a trend — you fight the band walk and lose.
- Trading the squeeze early before price actually breaks out.
- Ignoring the middle band, which is a valuable trend and support/resistance reference.
- Using bands alone without momentum or price-action confirmation.
Frequently asked questions
What do Bollinger Bands tell you? Bollinger Bands measure volatility and show where price sits relative to its recent range. Widening bands mean rising volatility, narrowing bands mean a possible upcoming move, and band touches show relatively high or low prices.
What is the best Bollinger Band setting? The standard 20-period simple moving average with 2 standard deviations is the most widely used and works well across most markets and timeframes.
Is a touch of the upper band a sell signal? Not necessarily. In a strong uptrend price can ride the upper band. A band touch only signals a relatively high price, so it needs confirmation before acting.
What is a Bollinger Band squeeze? A squeeze is when the bands contract tightly due to low volatility. It often precedes a strong breakout, though it does not indicate direction on its own.
Key takeaways
Bollinger Bands turn volatility into a visual, self-adjusting envelope around price. Use the standard 20, 2 settings, trade mean reversion only in ranges, ride the band walk in trends, and watch the squeeze for breakout opportunities. Because the bands show relative price rather than absolute signals, always confirm with momentum tools and price action before you trade.
Overlay Bollinger Bands, RSI and MACD on any currency pair in the FX Terminal charts workspace.