MACD Indicator Explained: How to Use Moving Average Convergence Divergence in Forex
A complete guide to the MACD indicator (Moving Average Convergence Divergence): the MACD line, signal line and histogram, crossovers, divergence, best settings, and four MACD trading strategies for forex.
FX Terminal Research · 2026-07-24 · 4 min read
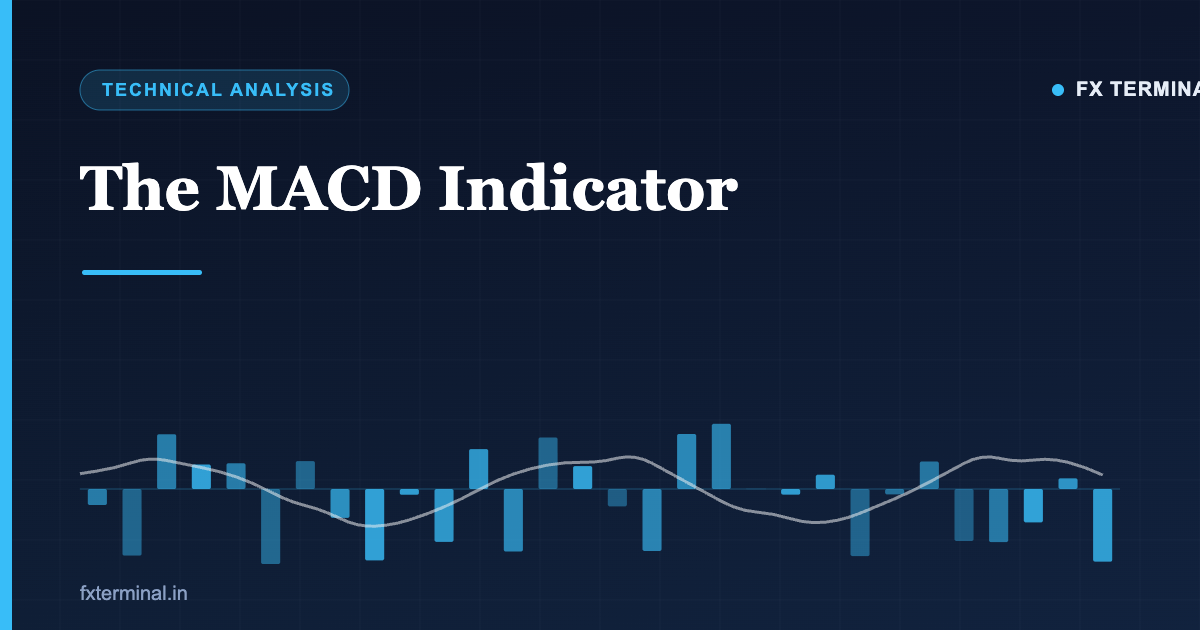
The MACD indicator — short for Moving Average Convergence Divergence — is one of the most popular momentum and trend-following tools in forex trading. It combines two moving averages into a single, easy-to-read display that shows the direction, strength and momentum of a trend. This guide explains how the MACD works, how to read its three components, the best MACD settings, and four proven MACD trading strategies.
What is the MACD indicator?
The MACD is a trend-following momentum indicator developed by Gerald Appel in the late 1970s. It measures the relationship between two exponential moving averages (EMAs) of price and displays the result as an oscillator that moves above and below a zero line.
Because it blends trend and momentum in one tool, the MACD helps traders answer two questions at once: which way is the market trending? and is that momentum speeding up or slowing down?
The three parts of the MACD
The MACD has three components that work together:
| Component | How it is built | What it shows |
|---|---|---|
| MACD line | 12-period EMA minus 26-period EMA | Momentum and trend direction |
| Signal line | 9-period EMA of the MACD line | A smoother trigger line for crossovers |
| Histogram | MACD line minus signal line | The gap between the two — momentum acceleration |
When the MACD line is above the signal line, momentum is bullish; when it is below, momentum is bearish. The histogram grows as momentum builds and shrinks as it fades.
Best MACD settings
The standard MACD setting is 12, 26, 9 — a 12-period fast EMA, a 26-period slow EMA and a 9-period signal line. These defaults suit most swing and day traders and are what Appel originally recommended.
- Faster settings (e.g. 5, 13, 8) produce quicker signals for short-term traders, with more noise.
- Slower settings (e.g. 19, 39, 9) smooth the indicator for position traders who want fewer, higher-quality signals.
For beginners, the default 12, 26, 9 is the best place to start.
Four MACD trading strategies
1. The signal line crossover
The most common MACD signal:
- Bullish crossover — the MACD line crosses above the signal line, hinting at rising momentum (a potential buy).
- Bearish crossover — the MACD line crosses below the signal line, hinting at falling momentum (a potential sell).
Crossovers work best in trending markets and generate false signals in choppy ranges.
2. The zero-line crossover
When the MACD line crosses above zero, the fast EMA has moved above the slow EMA — confirming a bullish trend. A cross below zero confirms a bearish trend. Zero-line crosses are slower but more reliable than signal-line crosses.
3. MACD divergence
Divergence is the MACD's most powerful signal:
- Bullish divergence — price makes a lower low while the MACD makes a higher low, warning that downside momentum is fading.
- Bearish divergence — price makes a higher high while the MACD makes a lower high, warning that upside momentum is weakening.
4. The histogram for momentum
The histogram peaks and troughs show momentum turning before a crossover happens. A shrinking histogram in an uptrend warns that buyers are losing steam — an early heads-up to tighten stops or take profit.
MACD vs RSI: what is the difference?
Both are momentum tools, but they measure different things:
- MACD is trend-following and unbounded — it shows momentum and trend direction, and it has no fixed overbought/oversold levels.
- RSI is bounded 0–100 and is designed to flag overbought and oversold extremes.
Many traders use them together: the MACD to confirm trend and momentum, the RSI to time entries at extremes.
Common MACD mistakes to avoid
- Trading crossovers in a range. Sideways markets produce whipsaw after whipsaw.
- Ignoring the higher timeframe trend. A bullish crossover against a strong daily downtrend is low-probability.
- Expecting precise timing. The MACD is a lagging, EMA-based tool — it confirms moves rather than predicting exact tops and bottoms.
- Over-optimising settings. Chasing the perfect inputs usually leads to curve-fitting.
Frequently asked questions
What does MACD stand for? MACD stands for Moving Average Convergence Divergence, a momentum indicator built from the difference between a 12-period and a 26-period exponential moving average.
Is MACD a leading or lagging indicator? The MACD is primarily a lagging indicator because it is derived from moving averages, but its divergence and histogram can give leading clues about momentum shifts.
What is the best MACD setting for forex? The default 12, 26, 9 setting works well for most forex traders. Shorter settings suit scalpers, while longer settings suit position traders.
Can MACD be used with other indicators? Yes. The MACD pairs well with the RSI, moving averages and support and resistance, which help filter its signals and confirm the trend.
Key takeaways
The MACD indicator packs trend direction and momentum into one display through its line, signal line and histogram. Use the default 12, 26, 9 settings, treat signal-line and zero-line crossovers as momentum cues, and watch for divergence as an early reversal warning. Because the MACD lags, always read it in the context of the higher-timeframe trend and confirm with price action for the best results.
Track live MACD momentum across every major currency pair on the FX Terminal charts and technical outlook dashboard.